Public Doctrine Series
Monetary Engineering
The Coefficient, Not the Level
The framework in a small open economy: a firm policy rate paired with a programme that shrinks the import sensitivity of prices, designed for Jamaica and tested in a thousand economies it was not tuned on
Dr. Glen Brown · President & CEO, Global Financial Engineering, Inc. and Global Accountancy Institute, Inc.
GFE-PUB-EMF-20261118-A · Revision B · 19 November 2026
Abstract
On 18 November 2026 the Bank of Jamaica raised its policy rate for the second meeting in a row, to 6.50 per cent, against an inflation that its own account traces to oil, freight, drought and a hurricane. In this paper I take the engineered monetary framework into the setting its synthesis left open: the small open economy, where the exchange rate carries both shocks and policy. The question is not whether the rate should rise. It is what an economy should build so that each future shock asks less of the rate.
The answer is a combined design. The policy rate keeps the framework’s engineered rule, including its own response to supply-driven inflation. Beside it, five instruments act on the import sensitivity of the price level: energy capacity, a food engine with a relief stock, a Supply Capacity Rate, a reserves-first defence of the currency, and a published Import-Displacement Ledger. Tuned on 300 shock histories and tested on 1,000 others, each in an economy whose structure differs from the central bank’s model, the combined design lowers the loss of the best conventional rule by 48 per cent. It reduces lost output by four-fifths, lowers the average policy rate by 1.5 points and cuts the import bill by about US$1.1 billion a year by the end of the decade. Nine tests were written before any result was computed. Eight held. The one that failed, a state-gated step-down of the rate’s supply response, is reported in full, because its failure explains why the design works.
I. A Rate Rise on a Supply Shock
At its meetings of 16 and 17 November 2026, the Monetary Policy Committee of the Bank of Jamaica voted unanimously to raise the policy rate by 50 basis points to 6.50 per cent, effective 19 November. It was the second consecutive increase. The first, on 28 September, had taken the rate from 5.50 to 6.00 per cent, the Bank’s first increase since November 2022. The Committee judged that inflation could remain above the 4 to 6 per cent target range until late 2027, a breach more persistent than it had previously communicated.
The numbers behind that judgement are not in dispute. Headline inflation was 8.2 per cent in October, down from 8.6 per cent in September but far above the 2.9 per cent of a year earlier, and the fifth consecutive month above the ceiling. Core inflation, which excludes agricultural food and fuel, rose to 5.4 per cent. Businesses’ twelve-month inflation expectations climbed to 8.3 per cent in September from 7.3 per cent in July. The Bank’s own list of causes reads like an inventory of things a domestic interest rate cannot touch: imported commodity prices, reconstruction spending after Hurricane Melissa, above-seasonal food inflation from a worsening El Niño, and the second-round effects of all three. Real growth for fiscal year 2026/27 is projected at between 0.5 and 1.5 per cent.
In September the Governor, Dr Brian Langrin, was asked how a higher rate could repair crop losses or lower the price of oil, and agreed that it could do neither. That is the question I take up here, and I want to state at the outset what this paper does not argue. It does not argue that the rate should not have risen; the rule I recommend would have raised it too, and by more at first. It argues that a strategy which answers every supply shock with the rate alone pays for each shock twice, once in prices and again in output, and leaves the economy as exposed to the next shock as it was to the last. The decade’s shocks are not hypothetical. Geography schedules the hurricanes, the Pacific schedules El Niño, and distant wars schedule the oil.
II. What the Rate Can Reach
The best evidence on how monetary policy works in Jamaica comes from the Bank of Jamaica itself. Reviewing the 2021–2024 tightening cycle in a speech published in May 2024, the then Governor, Richard Byles, described a three-pronged campaign: a policy rate raised 650 basis points, from 0.5 to 7.0 per cent; Jamaican-dollar liquidity drained through open market operations and higher reserve requirements; and intervention in the foreign exchange market. It succeeded. Inflation peaked at 11.8 per cent in April 2022 and was back to 5.6 per cent by March 2024.
How it succeeded is the decisive fact. By February 2024, after 650 basis points of tightening, weighted average deposit rates had risen 145 basis points and private-sector loan rates only 40. Byles called the credit channel “quite weak” and traced it to a concentrated banking system. The channels that did the work, he said, were the exchange rate and expectations, in an economy where roughly half of consumption is imported. In June 2026 he told Parliament that the weak pass-through to lending rates remained unresolved.
The implication is the hinge of this paper. In Jamaica the policy rate works mainly as a currency instrument and a signal; it is a weak brake on demand. The case for using it firmly is nonetheless strong. The Federal Reserve raised its target range to 3.75–4.00 per cent on 16 September 2026, and a narrowing differential invites capital to leave. A Bank of Jamaica working paper by Cappriece Clarke and Carey-Anne Williams finds exchange-rate pass-through to headline inflation of about 0.4 at twelve months and 0.6 at twenty-four while annual depreciation stays below 7.4 per cent, rising to 0.7 and 1.4 above it. A central bank facing that kink is rational to defend the currency before it reaches it. The question is what else it can be given to defend it with.
III. The Coefficient, Not the Level
The design begins with a decomposition of quarterly inflation into what households expect, what the world sends, what the currency adds, what the domestic harvest subtracts, and what demand contributes:
πₜ = πᵉₜ + Σₖ wₖ sₖ ψₖ p*ₖ,ₜ + ε(Mₜ) · Δeₜ + w_F (1 − s_F) ρ dₜ + κ xₜ (1)
Mₜ = Σₖ wₖ sₖ(t), ε(Mₜ) = ε₀ · Mₜ / M₀ (2)
Here wₖ is the weight of consumption block k in the price index, sₖ its import share, ψₖ the retail pass-through of a world price change p*ₖ, Δe the depreciation of the Jamaican dollar, d a domestic supply shock such as a hurricane or a drought, ρ the sensitivity of local food prices to it, and x the output gap. M is the import intensity of consumption. Equation (2) makes exchange-rate pass-through proportional to it: when less of what households buy crosses the border, a given depreciation moves fewer prices.
The calibration is anchored to published figures. Food and non-alcoholic beverages carry 35.8 per cent of the consumer basket. Jamaica imports roughly 90 per cent of its energy, and its oil bill has been close to US$2 billion a year. In 2025 the island imported US$7.52 billion of merchandise and exported US$1.65 billion. Renewable sources supplied 8.9 per cent of electricity in 2024 against a national target of 50 per cent by 2030. With those shares the model’s starting import intensity is 0.46, close to the Bank’s own estimate that half of consumption is imported, which is an independent check that the decomposition was not built to suit its conclusion.
Read against equation (1), the policy rate has two levers: the output gap, which in Jamaica it reaches weakly, and the exchange rate, which it reaches strongly but only for as long as the differential is held. It has no lever at all on the import shares sₖ. Those shares multiply every future shock twice, once directly through world prices and again through the import bill, which presses on the currency and sends the shock around a second time. Reducing them pays a double dividend. A rate rise buys today’s stability with tomorrow’s capacity; displacing imports buys tomorrow’s stability with today’s capital. The combined design does both, each with the instrument suited to it.
IV. The Combined Design
The engineered monetary framework, as its synthesis states it, already has the parts a closed economy needs: a policy rule with its own response to supply-driven inflation, a published supply-price signal, fast supply relief from strategic reserves, a credit instrument and a floor gate. Its open questions included the open economy itself. The design below keeps every one of those parts and adds what an import-dependent island requires.
The policy rate: the engineered rule, unchanged in form
The rate follows the framework’s rule, written here without the mortgage-stress term, which this model does not carry:
i*ₜ = r* + πᵉₜ + f_d (πₜ − π* − Ŝₜ) + f_s Ŝₜ + f_y xₜ + i^USₜ + 0.5 · max(0, Δe⁴ᵠₜ − 7.4) (3)
Ŝ is the supply-price signal, the contribution of imported and domestic supply prices to inflation over the past four quarters. i^US is the foreign policy rate, so that the differential is defended, and the last term acts at the depreciation threshold where the Bank’s own research finds pass-through turning complete. Tuned on the training histories, the rule set f_d at 2.5 and, crucially, f_s at 1.0. Offered zero, the tuning refused it: the best rule with no response to supply inflation was 7 per cent worse in training and 5 per cent worse in testing. This replicates in an open economy the finding of The Half-Credible Economy that looking through supply inflation does not do better. It also corrects Revision A of this paper, which proposed a look-through rule and is withdrawn on that point.
Instrument 1: Energy capacity
Imported fuel for power generation is the largest coefficient the economy can move within a decade. The national target of 50 per cent renewable electricity by 2030 is already policy; the design treats it as monetary infrastructure. Solar and wind with storage displace fuel bought in dollars and are financed by long-dated instruments serviced from the foreign exchange they save. The Jamaica Public Service Company’s replacement of its Hunts Bay plant with 133 megawatts of solar and 171.5 megawatts of storage, at about US$300 million, indicates the scale of a single step. The record of 2020 to 2024 shows the failure mode: the renewable share fell by about 3.8 points as demand grew by roughly a fifth. Capacity that does not outrun demand leaves the coefficient where it was.
Instrument 2: A food engine and a relief stock
Food carries more than a third of the price index. The engine has two parts. Irrigation, protected agriculture, cold chain and climate-resilient varieties lower the sensitivity of local food prices to a hurricane or a drought. A strategic stock of staples, released into price spikes on a published trigger and replenished in calm periods, is the framework’s fast supply relief given a physical form for an island that imports its cereals. Cereals and edible oils will remain imported, and for them the relief stock and forward purchasing are the defence.
Instrument 3: The Supply Capacity Rate
The cure for imported inflation is long-horizon investment financed with credit, which a higher policy rate makes dearer. The Supply Capacity Rate separates the two. It is central bank refinancing below the policy rate, available only against loans to projects that displace imports or earn foreign exchange, capped in quantity, audited by foreign exchange saved per Jamaican dollar lent, and subject to a sunset. The Bank of England’s Funding for Lending Scheme of 2012 and the European Central Bank’s targeted longer-term refinancing operations of 2014 are precedents for conditional refinancing; the eligibility test here is new. Whether the Bank of Jamaica Act permits such a facility in this form is a legal question I do not settle. It is distinct from the framework’s credit instrument, which restrains borrowing in a boom and does not bind at Jamaica’s present rates.
Instrument 4: Reserves first, the rate behind them
Gross reserves stood at US$6.91 billion at the end of March 2026, and on the Bank’s revised import prices the February stock covered about 42 weeks of goods imports. Under the design, intervention absorbs a larger share of depreciation pressure, but only down to a reserve floor, so that the defence is finite and its cost visible. Remittances, about US$3.9 billion in 2025, can be offered diaspora capacity bonds that finance the first two instruments, and tourism procurement can be linked to local food and power so that more of each visitor’s dollar stays on the island.
Instrument 5: The Import-Displacement Ledger
The framework holds that rules must be published and kept. The Ledger extends that principle to capacity. Each quarter it would publish the import intensity M, the estimated pass-through coefficient, the foreign exchange saved by completed capacity, and each programme’s progress against plan. The model allows it a modest credibility gain in proportion to progress, and Section VI shows that the conclusions survive when that gain is removed.
Why this is not the capacity device that failed
The series’ unpublished first working paper answered supply shocks with investment in capacity, and that device failed its tests; it was replaced by the supply-price signal and fast relief. The capacity in this paper is a different instrument. It is not a response to a shock and is not timed by the cycle. It is a decade-long reduction in a structural coefficient, built on a published schedule and judged by the import intensity it removes. The cyclical work is still done by the rate and by fast relief, as the framework specifies.
V. The Model and Its Discipline
The design is tested in a quarterly model of the Jamaican economy from 2027 to 2036, built on equations (1) to (3) with an expectations process, a demand equation, an exchange-rate block and a reserves account. Expectations mix the target with adaptive learning, and, as a concession to the rate, a stance above neutral also pulls them down directly. Demand responds to the real lending rate, which moves a tenth as much as the policy rate, as the Bank’s record implies. Depreciation pressure rises with the import bill and falls with the interest differential; intervention absorbs part of it until reserves reach a floor.
Five regimes are compared. A, the benchmark, is not a textbook rule but the best conventional rule, tuned on the same data: it responds to headline inflation and the output gap, with no instruments beside it. B is Revision A’s design, the five instruments with a look-through rule, kept only for comparison. C builds the same capacity under the conventional rule, without the relief stock, the Ledger or the Supply Capacity Rate, so that its programme slows when rates rise. D is the combined design. D+ is D with a step-down of the rule’s supply response once the relief stock is built, import intensity has made a set share of its planned progress, and expectations are back inside the band. It keys on state, never on the calendar.
Loss follows the series convention: the squared gap of inflation from the 5 per cent midpoint, half the squared output gap, and a quarter of the squared change in the policy rate. The mortgage-stress term is absent because this model has no mortgage block. Every rule was tuned on 300 training histories under the central bank’s own model, and every result reported below comes from 1,000 other histories. In each of them the economy’s pass-through, transmission, demand sensitivity, Phillips slope, expectations persistence and credibility are drawn away from the model the rules were tuned on, so that no rule is tested on the economy it was built for. A named stress scenario adds one decade a reader can follow: an oil shock of 40 per cent in 2028, a world food shock with a hurricane in 2030, a 150-basis-point Federal Reserve tightening in 2032 and a second oil shock in 2034. The nine tests were written down before any of these results was computed.
VI. What the Model Finds
Table 1. Ten-year outcomes across 1,000 held-out histories (means unless stated)
| Measure | A Conventional | C Capacity, conventional rule | D Combined |
|---|---|---|---|
| Loss (lower is better) | 7.82 | 5.02 | 4.05 |
| Mean inflation, % | 5.94 | 5.26 | 5.37 |
| Quarters above 6% (of 40) | 19.1 | 13.5 | 12.9 |
| Peak inflation, 95th percentile, % | 14.28 | 11.70 | 11.37 |
| Cumulative output loss, percentage-point-years | 4.08 | 1.37 | 0.76 |
| Mean policy rate, % | 7.94 | 6.78 | 6.40 |
| Highest policy rate, 95th percentile, % | 18.95 | 15.10 | 15.23 |
| Output relative to starting trajectory, mean, % | −0.34 | +0.43 | +0.55 |
| Merchandise import bill, final year, US$bn | 8.15 | 7.03 | 7.03 |
| Effective exchange-rate pass-through, end | 0.66 | 0.54 | 0.54 |
| Interest cost on repricing J$ debt vs 6.5%, % of GDP a year | +0.43 | +0.08 | −0.03 |
The combined design records a lower loss than the conventional benchmark in 92.4 per cent of histories, than capacity under the conventional rule in 77.5 per cent, and than the look-through design of Revision A (loss 4.27) in 66.9 per cent. The interest-cost row assumes J$ public debt of 30 per cent of GDP repricing with the policy rate and is indicative only.
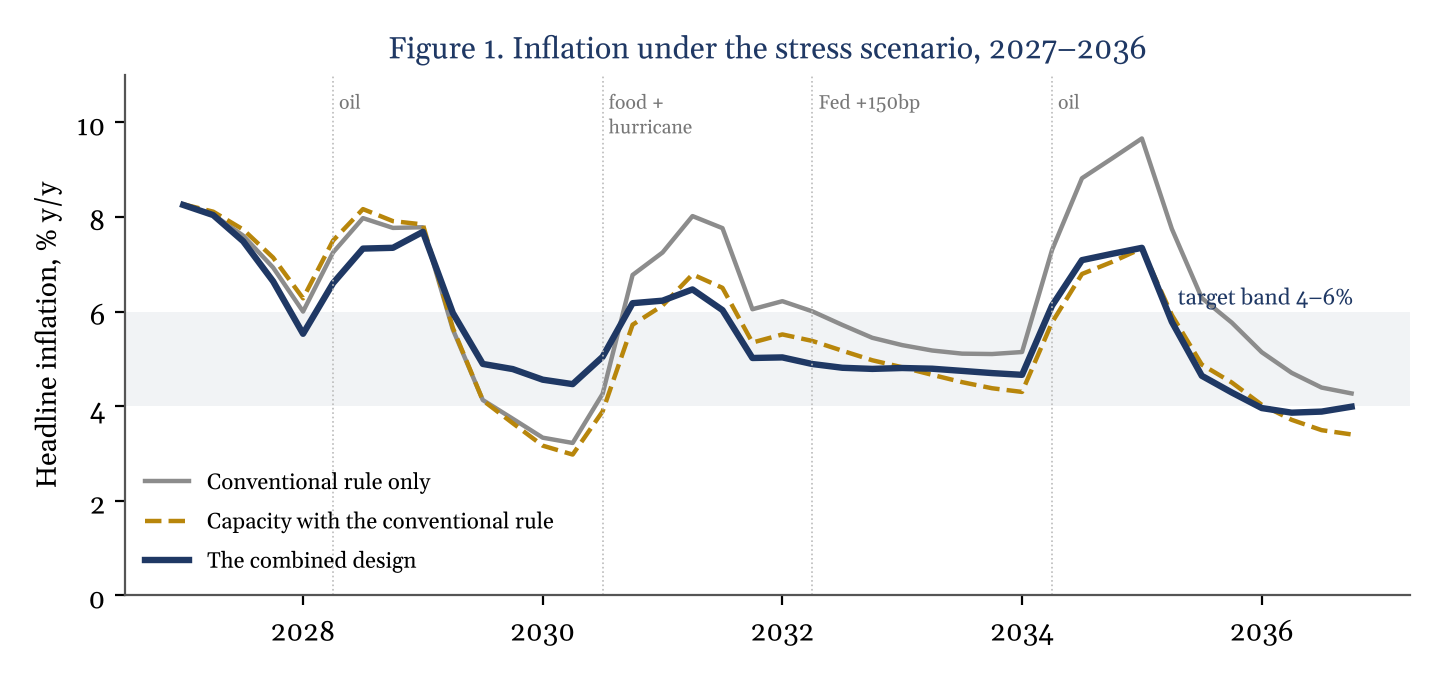
Figure 1. Headline inflation under the stress scenario. The combined design (navy) and capacity under the conventional rule (gold) separate from the conventional benchmark (grey) as capacity accumulates; the gap is widest at the second oil shock.
Three results stand out. The first is that capacity does most of the work. Building it under the unchanged conventional rule lowers the loss by 36 per cent, cuts the time above the ceiling by 29 per cent and lowers the final-year import bill by US$1.1 billion, and pass-through falls from 0.66 to 0.54 because fewer prices are set abroad. No setting of the policy rate achieves that in any history. The second is that the instruments beside the rate earn their place. Moving from capacity alone to the combined design lowers the loss by a further 19 per cent and almost halves the lost output, from 1.37 to 0.76 percentage-point-years, against 4.08 for the benchmark. The relief stock and the Supply Capacity Rate keep the programme on schedule when the rate is high. The engineered rule then answers supply inflation without needing to hold the rate high for long.
Table 2. The named stress scenario, 2027–2036
| Measure | A Conventional | C Capacity, conventional rule | D Combined |
|---|---|---|---|
| Mean inflation, % | 6.26 | 5.59 | 5.65 |
| Peak inflation, % | 9.66 | 8.27 | 8.25 |
| Quarters above 6% (of 40) | 21 | 15 | 16 |
| Cumulative output loss, pp-years | 4.89 | 1.42 | 0.78 |
| Mean policy rate, % | 9.09 | 7.94 | 7.39 |
| Highest policy rate, % | 12.55 | 11.21 | 11.15 |
| Loss | 4.51 | 2.87 | 2.17 |
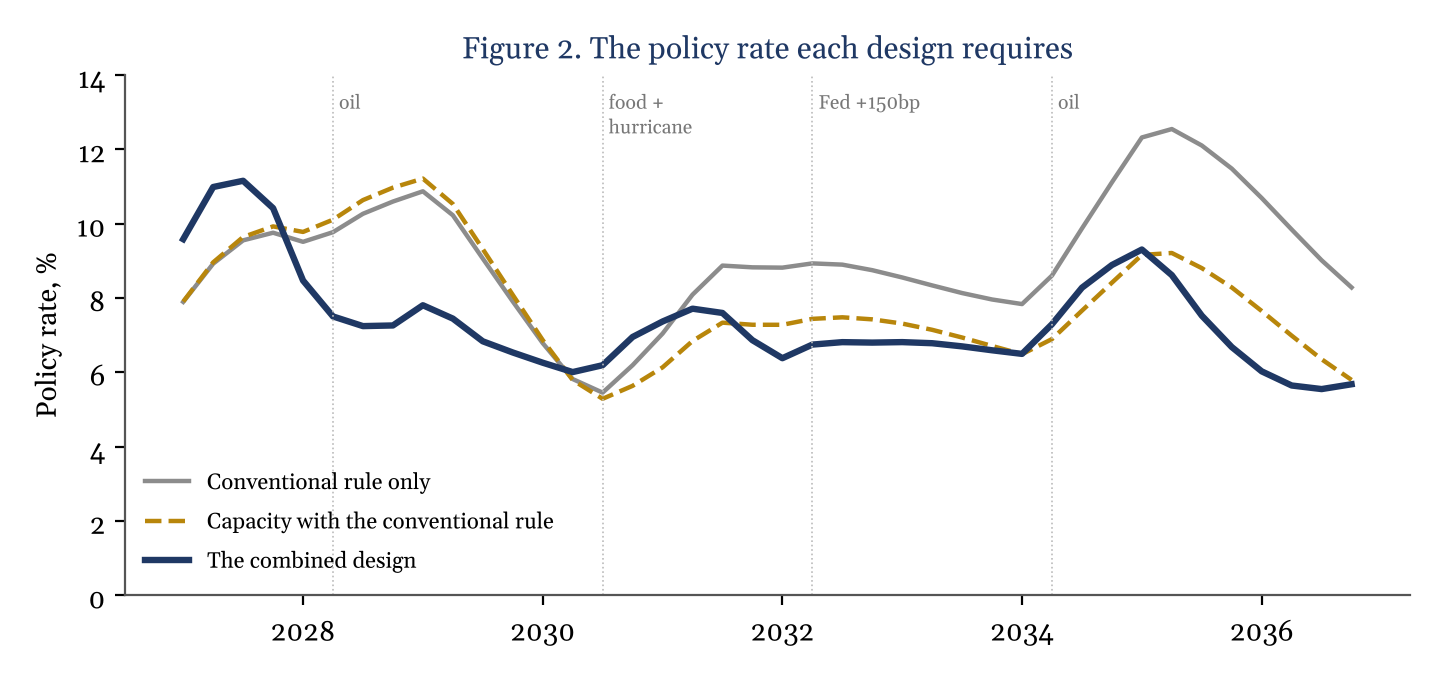
Figure 2. The policy rate each design requires under the stress scenario. The combined design acts earlier and harder in 2027, then runs lower for most of the decade; the conventional rule must climb to 12.6 per cent at the second oil shock.
The third result is the shape of the rate, and it is the one a reader should study most closely. In Figure 2 the combined rule acts first and hardest. Under the stress scenario it takes the rate to about 11 per cent in 2027, above the conventional rule’s path, because it answers the supply-driven inflation already in the index with its own coefficient and lets its last setting count for less. It then falls faster, runs lower through the middle of the decade, and needs only about 9 per cent at the second oil shock, when the conventional rule must reach 12.6. Across the held-out histories the combined design reaches its highest rate within the first two years in 92 per cent of cases, while the conventional rule’s median peak comes in the fifth year. The conventional rule’s peaks have the fatter tail, with a 95th-percentile peak of nearly 19 per cent against about 15. The combined design is a firm rate early and capacity for the decade, which is what the phrase “rate and capacity together” means in practice.
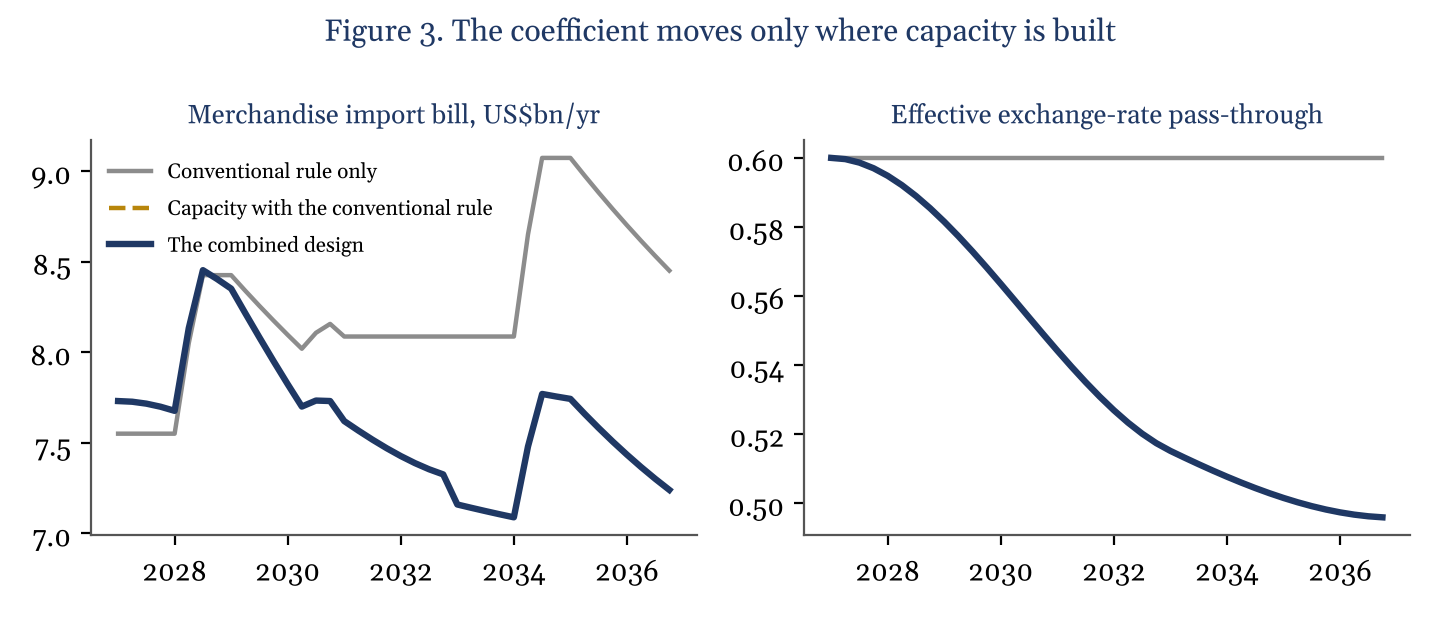
Figure 3. The import bill and the effective pass-through coefficient. The programme raises the import bill in its first years, because capacity is itself imported, before lowering it below the conventional path. The conventional rule never moves the coefficient. The two capacity designs build the same programme, so their lines coincide.
Table 3. Robustness: loss across 300 held-out histories under adverse variants
| Variant | A | B | C | D | D beats A |
|---|---|---|---|---|---|
| No credibility gain from the Ledger | 7.83 | 4.48 | 5.08 | 4.28 | 91% |
| Construction at half speed | 7.83 | 5.38 | 5.89 | 5.03 | 91% |
| Programme import content 80% | 7.83 | 4.39 | 5.10 | 4.20 | 93% |
| No relief stock, no resilience works | 7.83 | 4.93 | 5.41 | 4.70 | 86% |
| Smaller programme (energy to 0.78, food to 0.40) | 7.83 | 5.29 | 5.93 | 5.00 | 91% |
| Reserve floor raised to US$5.5bn | 7.97 | 4.43 | 5.12 | 4.24 | 91% |
| Twice the currency pressure from the import bill | 15.57 | 7.71 | 8.71 | 7.27 | 72% |
A conventional benchmark, B look-through design of Revision A, C capacity under the conventional rule, D combined design. Every economy in every variant differs from the model the rules were tuned on.
The ordering survives every variant in Table 3. The combined design has the lowest loss in each, and it beats the conventional benchmark in between 72 and 93 per cent of histories. It also no longer carries Revision A’s weakness. In Revision A’s own tests, removing the relief stock and the resilience works put its look-through rule behind capacity under the conventional rule. Here the combined design keeps a clear lead over capacity alone with both removed, 4.70 against 5.41, because it never stops answering supply inflation with the rate. When construction runs at half speed, the advantage over the benchmark narrows from 48 to 36 per cent, and the average rate rises by about 0.9 points. Execution remains the largest single risk.
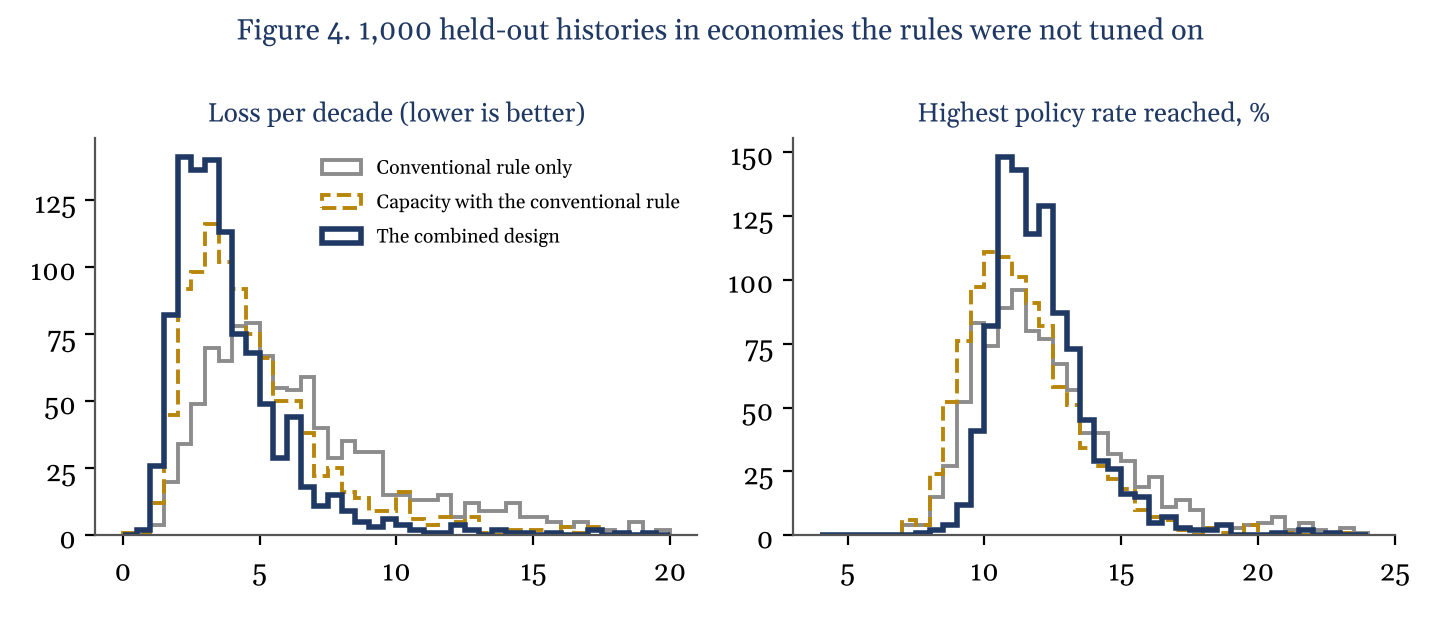
Figure 4. Distributions across 1,000 held-out histories. Left: loss per decade. Right: the highest policy rate each design reaches. The combined design concentrates its peak early and removes the right tail in which a bad decade drives the conventional rule toward 20 per cent.
VII. The Test That Failed
One of the nine tests failed, and it is the most instructive. In the discussion that led to this revision, I proposed that the rate should carry the heavy load while capacity is being built and then hand over: once the relief stock existed, import intensity had fallen and expectations were back in the band, the rule’s response to supply inflation should step down. I keyed the handover on state rather than the calendar, tuned it on the training histories, and wrote down in advance that it must beat the combined design without it. It did not. The best step-down the tuning could find left the training loss slightly worse, and across the held-out histories the two designs were indistinguishable, 4.055 against 4.049, each winning about half the time.
The reason is the paper’s thesis in miniature. The rule multiplies the supply-price signal by its coefficient, and the signal is itself the product of the import shares. As capacity displaces imports, the signal shrinks, and the rate’s response to supply shrinks with it, automatically and in proportion to the progress actually made. No handover is needed because the coefficient that matters is not the rule’s f_s but the economy’s sₖ, and the programme is already moving it. The rule never has to change. What it is asked to respond to gets smaller each year. The step-down is not adopted.
VIII. Cost, Capture and Mandate
The programme is not cheap, and the model charges it in full: 1.2 per cent of GDP a year for six years in energy, about US$1.44 billion on a GDP of US$20 billion, and 0.3 per cent a year for ten years in food, about US$0.6 billion. Sixty per cent of that spending is imported equipment, so the import bill rises before it falls, the J-curve at the left of Figure 3. Against that, the held-out histories end the decade with an import bill about US$1.1 billion a year lower, a recurring saving against a cost incurred once. That figure is the output of stated assumptions, not a forecast.
Three risks lie outside the model. The first is capture: cheap credit attracts the connected, and the Supply Capacity Rate is defensible only with its eligibility audit, quantity caps, sunset dates and quarterly publication in the Ledger. The second is mandate. Energy, food and the currency-linkage measures are fiscal and structural, not monetary. They require a government programme and a coordination with the central bank that leaves its independence in setting the policy rate untouched. Fiscal Space Is a Price explains why that coordination carries a price of its own when sovereign borrowing costs rise. The third is physical. An island cannot grow its wheat, refine its own crude or manufacture its own solar panels at scale. The design reduces the coefficient and cannot remove it. Any version of this argument that promises self-sufficiency should be distrusted on sight.
IX. The Evidence Ledger
Table 4. Every test written in advance, and its verdict
| Test | Pass mark | Result | Verdict |
|---|---|---|---|
| T1 Combined beats the conventional benchmark | Loss lower by at least 25% | −48% | Held |
| T2 Combined beats the look-through design | Lower loss | 4.05 against 4.27 | Held |
| T3 The tuning keeps a response to supply inflation | f_s above zero | f_s = 1.0 | Held |
| T4 Lower tail of the policy rate | 95th-percentile peak at least 2 points lower | 3.7 points lower | Held |
| T5 Output protected | Lost output at most half the benchmark’s | 19% of it | Held |
| T6 Instruments beside the rate earn their place | Combined beats capacity alone | 4.05 against 5.02 | Held |
| T7 State-gated step-down earns its place | Combined with step-down beats combined | 4.055 against 4.049 | Failed |
| T8 Robust to adverse variants | Combined beats benchmark in every variant | 7 of 7 | Held |
| T9 No inflation bought with output | Mean inflation no higher than the benchmark | 5.37 against 5.94 | Held |
Revision A of this paper, circulated internally on 18 November and not published, is superseded. It proposed a policy rule that looked through the direct import-price term. That rule contradicted the framework’s finding that look-through does not do better, and it is withdrawn: the combined design beats it in two histories of every three. Revision A also scored rules with a loss that omitted the cost of moving the rate, and it compared them with a Taylor rule that had not been tuned. Revision B adopts the series’ loss, tunes the benchmark on the same data as the design, and tests every rule in economies that differ from its own model. Every number in this revision was computed afresh under those standards.
Table 5. The seam: principal claims by evidential status
| Claim | Status |
|---|---|
| The Bank of Jamaica raised its rate to 6.50%; inflation, core and expectations as stated | Sourced |
| In Jamaica the rate works mainly through the exchange rate and expectations | Sourced (Bank of Jamaica) |
| The combined design beats the best conventional rule across economies it was not tuned on | Derived |
| The rule should keep its response to supply-driven inflation in an open economy | Derived |
| Capacity does most of the work; the instruments beside the rate protect output and the schedule | Derived |
| No handover of the rule is needed, because the supply signal shrinks with the import shares | Derived; inference as mechanism |
| A Supply Capacity Rate can be run without capture | Inference |
| The design’s magnitudes for Jamaica | Derived under stated assumptions; not a forecast |
X. What Would Falsify This Reading
- If measured exchange-rate pass-through does not fall as import intensity falls, because pricing conventions or dollar invoicing keep it high regardless of what is imported, equation (2) is wrong and the double dividend shrinks to a single one.
- If new renewable capacity is absorbed by demand growth, as between 2020 and 2024, so that fuel imports per megawatt-hour do not fall, the energy instrument fails on its own terms. The Ledger exists to detect this within quarters.
- If Jamaican firms’ expectations respond to the rate far more than the model allows, the conventional benchmark is cheaper than it appears here, and the margin narrows.
- If the relief stock cannot be run without leakage or political capture, part of the combined design’s advantage over capacity alone is lost, although Table 3 shows the ordering surviving its removal.
- If construction runs at half the assumed speed or less, the advantage narrows sharply. The design stands or falls on execution.
XI. Place in the Series
The synthesis, The Engineered Monetary Framework, listed the open economy among the questions that remained open. This paper answers it for one economy and in one model. Four elements join the specification for an import-dependent economy: import intensity as a state variable that policy can move; a Supply Capacity Rate that separates the price of the signal from the price of the cure; a relief stock that gives fast supply relief a physical form; and a published Ledger that anchors expectations with evidence. The policy rule itself is unchanged in form, and its response to supply inflation is confirmed rather than removed.
The Bank of Jamaica has done what its instrument allows, and on the evidence of 2021 to 2024 it has done it competently. The instrument is the limitation. While half of what Jamaicans consume crosses the border, every war, drought and hurricane will arrive as inflation, and the rate will be raised against causes it cannot reach. The engineering task is to shrink that half, deliberately, measurably and on a published schedule, while the rate does the work only a rate can do. Over time the rate becomes what it should be: firm when it must be, and needed less each year.
References
Bank of Jamaica, Monetary Policy Press Release, November 2026. https://boj.org.jm/monetary-policy-press-release-november-2026/
Bank of Jamaica, Summary of Monetary Policy Discussion and Decisions, November 2026. https://boj.org.jm/summary-of-decisions-november-2026/
Jamaica Observer, “BOJ increases policy rate to 6% to contain inflation”, 29 September 2026. https://www.jamaicaobserver.com/2026/09/29/boj-increases-policy-rate-6-contain-inflation/
Jamaica Observer, Governor Langrin on further increases, 30 September 2026. https://www.jamaicaobserver.com/2026/09/30/boj-hold-rates-inflation-expectations-settle/
Jamaica Observer, “Rate hikes possible, economist warns”, 29 September 2026. https://www.jamaicaobserver.com/2026/09/29/rate-hikes-possible-economist-warns-boj-move/
R. Byles, “Jamaica’s experience with the transmission mechanism during the tightening cycle”, BIS central bankers’ speeches, May 2024. https://www.bis.org/review/r240510c.htm
Jamaica Observer, Byles’s final report to Parliament, 14 June 2026. https://www.jamaicaobserver.com/2026/06/14/byles-leaves-boj-strong-reserves-harder-rate-test-ahead/
C. Clarke and C.-A. Williams, “Is Exchange Rate Pass-Through to Prices in Jamaica Non-linear?”, Bank of Jamaica Working Paper. https://boj.org.jm/amsconference54/wp-content/uploads/2023/10/Is-Exchange-Rate-Pass-Through-to-Prices-in-Jamaica-Non-Linear_Williams_Clarke_BOJ.pdf
STATIN, Jamaica Revised CPI, April 2020 (basket weights). https://statinja.gov.jm/pdf/Jamaica%20Revised%20CPI%20April%202020.pdf
Jamaica Observer, “Jamaica’s US$2.24-bn import dependence”, 15 July 2026. https://www.jamaicaobserver.com/2026/07/15/jamaicas-us2-24-bn-import-dependence/
Gleaner editorial, “Accelerating renewables”, 20 March 2026. https://jamaica-gleaner.com/index%2Ephp/article/commentary/20260320/editorial-accelerating-renewables
Jamaica Observer, “Policy barriers slow Caribbean renewable energy shift”, 4 October 2026. https://www.jamaicaobserver.com/2026/10/04/policy-barriers-slow-caribbean-renewable-energy-shift/
Jamaica Gleaner, “JPS spending US$300m on renewable energy expansion”, 9 May 2025. https://jamaica-gleaner.com/article/business/20250509/jps-spending-us300m-renewable-energy-expansion
Jamaica Observer, “Oil shock squeezes reserve cushion”, 24 April 2026. https://www.jamaicaobserver.com/2026/04/24/oil-shock-squeezes-reserve-cushion/
Jamaica Observer, “Food bill dips”, 14 February 2024. https://www.jamaicaobserver.com/2024/02/14/food-bill-dips/
Trading Economics, Jamaica imports and remittances. https://tradingeconomics.com/jamaica/imports
G. Rudebusch and L. Svensson (1999), “Policy Rules for Inflation Targeting”, in J. Taylor (ed.), Monetary Policy Rules, University of Chicago Press.
Appendix: Calibration, Tuning and Reproducibility
Provenance tags: S = sourced from a published figure; D = derived from published figures; A = assumption, stated so that it can be tested; T = tuned on the training histories only. GDP is taken as US$20 billion (A). In the held-out histories the parameters marked with an asterisk are redrawn for each economy within the range shown.
| Parameter | Value | Tag | Basis |
|---|---|---|---|
| Food weight in CPI, w_F | 0.358 | S | STATIN basket from the 2017 Household Expenditure Survey |
| Energy-sensitive weight, w_E; other tradables, w_T | 0.15; 0.20 | A | Carved from housing/utilities (17.8%) and transport (11.2%) |
| Energy import share, s_E | 0.90 → 0.65 | S / D | ~90% of energy imported; renewables 8.9% (2024) to 50% target; power about half of fuel imports (A) |
| Food import share, s_F | 0.45 → 0.35 | A | Ten-year programme |
| Exchange-rate pass-through, ε₀ * | 0.6 (0.4–0.9); 1.0 above 7.4% depreciation | S | Clarke & Williams, BOJ working paper |
| Retail pass-through of world prices, ψ_E; ψ_F * | 0.6 (0.4–0.8); 0.5 (0.35–0.65) | A | |
| Policy-to-loan-rate pass-through, θ * | 0.10 (0.05–0.30) | D | 650bp moved loan rates ~40bp, deposits ~145bp (BOJ, 2024) |
| Demand sensitivity, σ *; money-market channel, σ_m | 0.30 (0.15–0.60); 0.10 | A | |
| Signalling effect of the rate on expectations, ζ * | 0.15 (0–0.30) | A | Concession to the rate |
| Expectations persistence, μ *; credibility, c * | 0.75 (0.6–0.9); 0.30 (0.2–0.4) | A | Ledger adds up to 0.10 to c with progress |
| Phillips slope, κ * | 0.12 (0.06–0.20) | A | |
| Oil bill; food imports; other imports | US$2.0bn; 1.35bn; 4.2bn | S / D | Food: US$1.04bn Jan–Sep 2023 annualised |
| Reserves; intervention floor | US$6.9bn; 4.5bn | S / A | End-March 2026 |
| Programme cost | 1.2% of GDP × 6 years (energy); 0.3% × 10 (food) | A | 60% import content |
| Relief stock absorption; domestic food sensitivity | 30%; 0.6 | A | From year 3 |
| Conventional rule: response to inflation; to output; smoothing | 2.5; 0.25; 0.85 | T | Grid 1.25–3.0; 0.25–1.0; 0.5–0.85 |
| Engineered rule: f_d; f_s; f_y; smoothing | 2.5; 1.0; 0.25; 0.5 | T | Grid 1.0–3.0; 0–1.5; 0.25–1.0; 0.5–0.85 |
| Initial state | Policy rate 6.5%; headline 8.2%; supply term 2.8pp; expectations 7.5% | S / D | BOJ, November 2026 |
Reference implementation emf8b_model.py (SHA-256 9cf0e3cb4ecb94b01e10a1503f968e7ec9fb7401b9ffcfb0ce2634ed053d4870), with tune_eval.py (training histories, seeds 0–299), heldout.py (held-out histories, seeds 1000–1999, perturbed economies, stress scenario and variants) and TESTS_PREREGISTERED.md, written before any Revision B result was computed. Two tuned coefficients sit at the edge of their grids (output response at the bottom, conventional smoothing at the top) and are reported as such. The model is calibrated to published Jamaican figures but is not estimated, and its results compare designs under common assumptions rather than forecast Jamaica’s economy.
The Monetary Engineering series
The Better Ways: the engineered framework: a rate rule with a credit instrument and supply relief, tested against the best conventional rule.
Room Above the Floor: the inflation target as the room an economy needs above the floor, and a mortgage reset cap.
The Half-Credible Economy: the framework under forward-looking expectations, and why partial credibility is the most dangerous state.
The Backstop at the Floor: a fiscal rule written in advance that removes the deflation trap.
Fiscal Space Is a Price: the backstop under a sovereign risk premium and the marginal cost of debt.
The Engineered Monetary Framework: the whole framework in one specification; the place to start.
The Coefficient, Not the Level: the framework in a small open economy: a firm rate paired with a programme that shrinks import sensitivity.
Download the PDF
About the Author
Dr. Glen Brown is President & CEO of Global Financial Engineering, Inc. and Global Accountancy Institute, Inc. He is the architect of the GCPIAUT framework and the broader GATS-native proprietary capital doctrine. His work focuses on sovereign capital governance, algorithmic trading architecture, reserve-first compounding systems, and institutional financial engineering within closed proprietary environments.
Business Model Clarification
Global Financial Engineering, Inc. and Global Accountancy Institute, Inc. operate as closed-loop proprietary institutions. They do not offer public investment products and do not invite retail participation into their proprietary capital architecture. This paper is policy research published for intellectual and institutional discussion.
Disclaimer
This paper is analysis, not advice. It takes no position on any particular decision of any central bank or government, and nothing in it constitutes investment advice, an offer, a solicitation, or a recommendation to buy or sell any financial instrument.